2017 AFDR: It's Benchmarking Time!
167 brands deliver actionable recruitment data
Results from the 2017 Annual Franchise Development Report (AFDR) were unveiled in late September at the 18th annual Franchise Leadership & Development Conference in Atlanta. The 2017 AFDR is based on responses from 167 franchisors representing 60,989 units (51,789 franchised and 9,200 company-owned).
Participants in the survey consisted of franchisors that completed an online questionnaire. Responses were aggregated and analyzed to produce a detailed look into the recruitment and development practices, budgets, and strategies of a wide cross-section of franchisors. The data and accompanying commentary and analysis provide the basis of the 2017 AFDR.
Highlights from the report were presented in a general session at the conference by Franchise Update Media CEO Therese Thilgen. Among her observations based on the AFDR data were:
- Franchisees are getting younger. Are you prepared?
- The two most important factors for development are franchisee validation and a strong sales process.
- Recruitment budgets were up in 2016.
- Half of ad spending for recruitment spending is for digital.
- Four in 10 brands still don't track cost per lead or cost per sale.
- 44 percent of food brands exceeded their goals in 2016.
- International expansion for U.S. brands continues to grow.
Growth plans for 2017 from the 167 respondents target a total of 6,536 additional franchise units, 1,966 through existing franchisees and 3,843 from new franchisees. For comparison, last year's growth plans from 134 brands targeted a total of 6,442 additional units; and for 2015 those numbers were 6,063 total new units from 139 brands.
Below are additional highlights from the 2017 AFDR. Ordering information can be found at the bottom of the page.
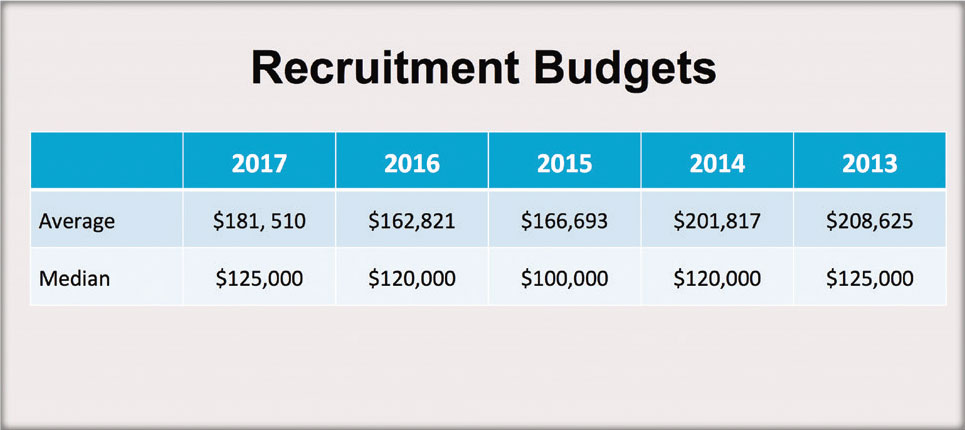
- Recruitment budgets. Average media budget plans for 2017 for franchise sales and recruitment (advertising and media expenses, not including brokers and employee compensation) among respondents was $181,510, with a median of $125,000. This is an increase from last year, where the corresponding numbers were $162,821 and $120,000. This could indicate more intense competition not only for quality candidates, but also higher internal costs stemming from salaries and commissions for the best salespeople.
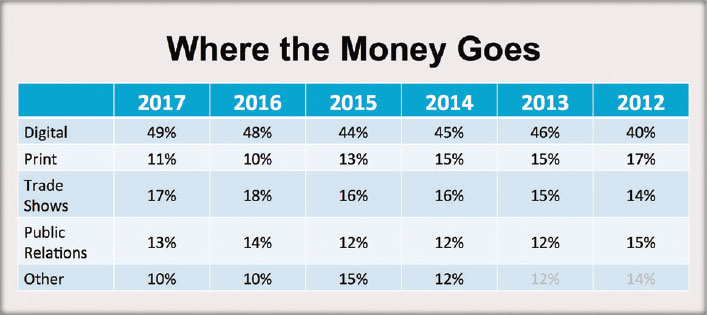
- Where the money goes. Planned allocation of respondents' 2017 recruitment budgets remained essentially the same as in previous years, with some variation in print and trade show spending. At 49 percent, spending on digital continues to increase and is expected to continue growing and account for half or more of all recruitment spending next year as prospects' use of mobile devices to explore franchise opportunities continues on its own growth trajectory. Spending on print has stabilized after a few years of decline, while budgeting for trade shows (17 percent) and public relations (13 percent) remained about level with 2016.
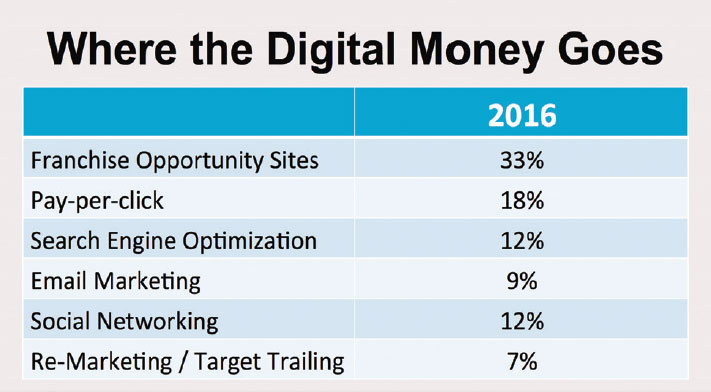
- Where the digital money goes. We also asked franchisors to break out their digital spending. Franchise opportunity sites, the largest category by far, accounted for one in three dollars in this category (33 percent), down slightly from 36 percent last year. Pay-per-click remained steady at 18 percent, while SEO (12 percent) fell slightly from 15 percent last year. Together, PPC and SEO accounted for three in 10 dollars spent on digital (30 percent). Email marketing, social networking, and remarketing together accounted for about one in three dollars (28 percent) spent on digital marketing in 2016.
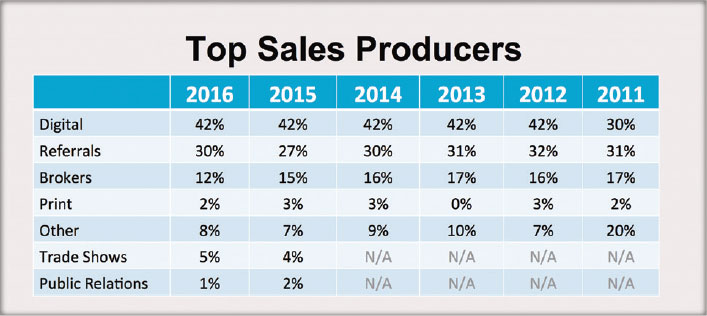
- Top sales producers. After taking the lead in 2012 as the top sales producer, digital continues to dominate, holding steady at 42 percent over the past 5 years. The other sources, which accounted for about six in 10 sales, have remained fairly steady over the past 6 years (except for "Other" in 2011, which has fallen by more than half as franchise brands have become better at tracking the sources of their sales). Referrals, considered by most to be the strongest source of leads, remains responsible for three of 10 sales (30 percent). However, when it comes to attributing sales to online or digital sources, it's important to keep in mind that, as Gary Gardner, chair of Franchise Update Media, pointed out at last year's conference, "The last click gets the credit." He urged attendees to consider the extent to which their other efforts contribute to the more easily measured digital share of spending on sales.
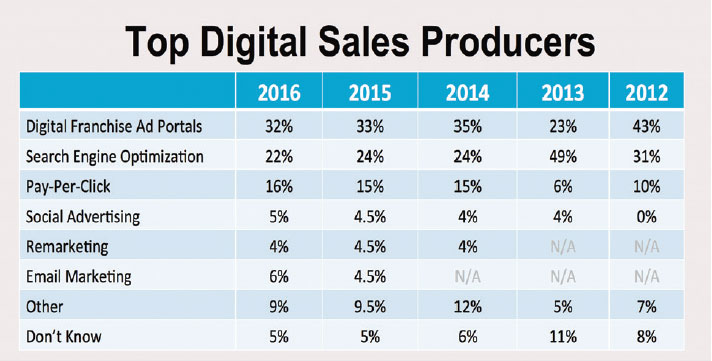
- Top digital sales producers. With digital spending accounting for more than four in 10 sales and holding steady for the past 5 years (see above), we asked respondents to segment their digital spending as it relates to sales. With the numbers for 2016 nearly identical with those of the previous year, we can surmise that, after an uneven beginning as franchisors learned the ropes of online recruitment, digital has settled into place as a source for franchise sales (that is, until the next disruptive technology appears on the scene). Over the past 3 years, ad portals led the way as a source for franchise sales, accounting for about one in three sales over the past 3 years. The next two leading digital sales sources, SEO and PPC, also have held steady for the years 2014 through 2016.
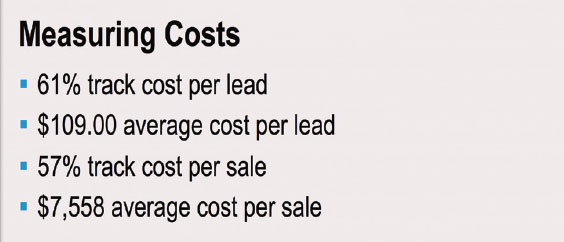
- Measuring costs. About six in 10 respondents said they track cost per lead (61 percent, compared with 60 percent last year) and cost per sale (57 percent, compared with 58 percent last year). This means that four in 10 respondents still do not track cost per lead and cost per sale, a number that franchise recruitment experts continue to shake their heads over, wondering how any professional sales team can set a budget, spend the money, and not measure the effectiveness of that effort. On a positive note, the number of brands tracking cost per lead and cost per sale has improved from several years ago (52 percent in 2014, about the same in 2013, and 65 percent in 2012). Why 100 percent of brands don't track these critical metrics remains a mystery. The average cost per lead reported in this year's survey was $109, up from $97 last year, while the average cost per sale of $7,558 also was up, from $6,300 last year.
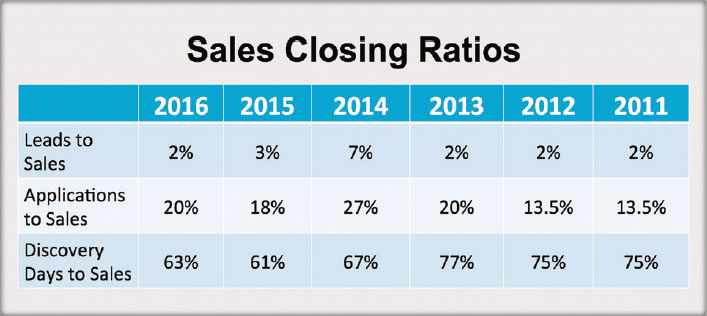
- Sales closing ratios. Again, not much change from the previous year. Although the ratios for 2015 and 2016 were lower than those in 2014, our panel of experts for that year categorized the 2014 figures as unusually high, more of an aberration than a norm. At 2 percent, the lead-to-sales ratio in 2016 was more in line with the numbers from the past 5 years. The applications-to-sales ratio, at 20 percent, is in line with 2015 and 2013, and much improved from 2011 and 2012. While the discovery days-to-sales ratio held fairly steady compared with the two previous years, those ratios dropped noticeably from 2011-2013.
Last year we wondered if more unfit candidates were getting through to discovery days, if franchisors were becoming more selective in the final stage of the award process, or if the economy or financing issues were the reason for the decline. This year we're hearing that greater uncertainty stemming from the sluggish economic recovery has dampened the appetite for risk among candidates, and that increased competition for prime real estate sites for the many brands that have similar footprints are contributing factors to the decline here. In the legal panel at the Franchise Leadership & Development Conference, many questions were about external threats to the franchise business model coming from regulators and legislators. Whether the threats are real or not, this could be another factor as candidates question the long-term viability of a brand's profit model in light of possible future restrictions. Franchisors must examine their discovery day process to see where candidates are dropping out and conduct exit interviews with those who drop out, asking why.
- Franchisors exceeding goals. Several clear trends are apparent among brands that exceeded their goals in 2016. Their cost per lead, at $76.50, was significantly lower than the average cost per lead of $109 reported by all respondents. Cost per sale, at $6,266, also was much lower than the average of $7,558. This would indicate that the franchisors exceeding their goals are much more efficient in their recruitment spending. Interestingly, the "exceeders" had a lower applications-to-sales ratio than the entire survey group (15 percent, compared with 20 percent). However, the discovery day-to-sales ratio of 80 percent for those who exceeded their goals was much higher than the average of 63 percent for the entire group. This could indicate that the most successful brands weed out non-viable candidates earlier in the process, rejecting more applicants before they get to discovery day. Looking at money as a factor, 57 percent of those with an investment per unit above $250,000 exceeded their goals, compared with 71 percent the year before. There seems to be increasing evidence building that although lower-cost concepts are easier to afford for those starting out in franchising, the food sector is overcrowded and the big action is coming at the higher end, driven by ever-larger multi-unit operators. More brick-and-mortar service concepts, however, exceeded their goals in 2016 than the year before. A comparison of the "exceeders" with last year's respondents by industry segment shows the following:
|
Segment |
2016 |
2015 |
|
Food |
44% |
59% |
|
Retail non-food |
9% |
11% |
|
Service (brick & mortar) |
30% |
15% |
|
Service (territory/pop.) |
9% |
11% |
|
Retail food |
9% |
4% |
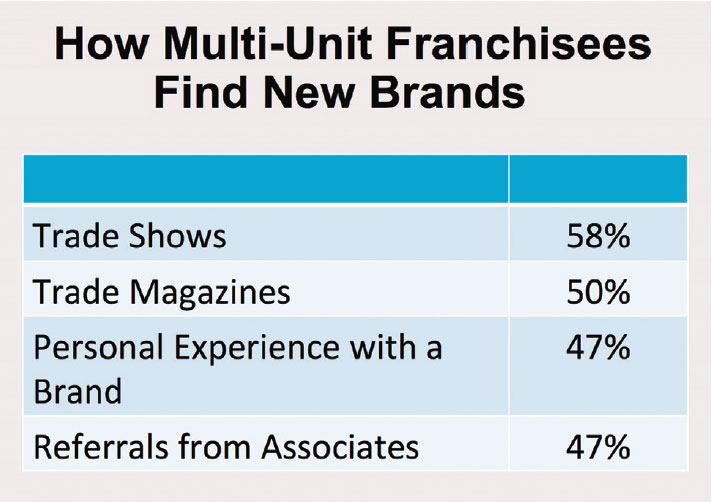
- How multi-unit franchisees find new brands. About six in 10 (58 percent) of multi-unit operators said they attend trade shows to find new opportunities, down from 67 percent last year. Other ways they find new brands include: trade magazines (50 percent, up from 36 percent last year); personal experience with a brand (47 percent, up from 36 percent last year); and referrals from associates (47 percent, up from 28 percent last year). Multi-unit operators at our annual Multi-Unit Franchising Conference overwhelmingly say that networking opportunities with their peers to learn about new brands, along with the opportunity to meet with new brands in the Exhibit Hall were among the top reasons they attend.
10 Differentiators
The following are 10 of the most important things the more successful brands have seen or done that make their franchise offering more attractive to prospects and candidates:
- Telephone leads are more important than online submissions
- Quality of leads is up
- Involvement in trade associations to connect with franchise prospects
- Provide FPRs
- More multi-brand franchisees
- Unit-level performance
- Modification of fees
- Resale agreements in FDDs
- Lower resale rate
- Higher compensation packages for sales executives
2017 AFDR Now Available!
The 2017 Annual Franchise Development Report (AFDR) delivers data collected from 167 franchisors representing 60,989 units, with responses organized by industry, unit investment, system-wide sales, and more. The annual report provides franchisors with the ideal tool for studying their development practices, benchmarking their sales and recruitment budgets against their own industry categories, and setting goals and budgets for the year ahead. The report also includes research into online recruitment practices, the growing use of mobile and social tools by prospects, and best practices by franchisors.
The AFDR, the only sales and lead generation benchmark report available in franchising, identifies industry sales trends and top lead generation sources for meeting sales goals. For example:
- How does your sales budget compare with other brands in your segment?
- Are your closing ratios in line with your industry and investment level?
- What conversion rates should you expect from your website?
- Is your online spending paying off? How do you know?
- Are your brokers delivering--and is their price per deal too high?
- Are you using referrals, and how much are you paying for them?
- How are franchisors using social media to recruit candidates?
- Some franchisors are exceeding their sales goals. What are they doing differently from those falling short?
The 2017 AFDR is packed with timely information and benchmarking data that can help your franchise system grow faster and close more deals--while saving thousands of dollars in cost per sale. Based on in-depth surveys from 167 franchise companies, this thoroughly researched report reveals the success drivers that are sure to boost the output and quality of your sales department.
Filled with the most comprehensive sales and lead generation data in franchising, the 2017 AFDR, at more than 190 pages, is a must-buy tool for franchisors, development consultants, and advertising, marketing, and technology suppliers--and is ideal for benchmarking and building budgets and media plans.
The complete 2017 AFDR, with analysis and benchmarks, is available for $350. For ordering information, call Sharon Wilkinson at 800-289-4232 x202 or email afdr@franchiseupdatemedia.com.
Share this Feature


Recommended Reading:
Comments:
comments powered by Disqus
FRANCHISE TOPICS
- Multi-Unit Franchising
- Get Started in Franchising
- Growth
- Operations
- Open New Units
- Leadership
- Marketing
- Technology
- Legal
- Awards
- Rankings
- Trends
- Featured Franchise Stories
FEATURED IN
Franchise Update Magazine: Issue 4, 2016


Franchising.com is produced by Franchise Update Media. Franchise Update Media has its finger on the pulse of franchising with unrivalled audience intelligence and market driven data. No media company understands the franchise landscape deeper than Franchise Update Media.
P.O. Box 20547
San Jose, CA 95160
PH. (408) 402-5681
 The franchise listed above are not related to or endorsed by Franchise Update or Franchise Update Media Group. We are not engaged in, supporting, or endorsing any specific franchise, business opportunity, company or individual. No statement in this site is to be construed as a recommendation. We encourage prospective franchise buyers to perform extensive due diligence when considering a franchise opportunity.
Copyright © 2001 - 2024. All Rights Reserved. Legal Notices | Privacy Policy