2021 Annual Franchise Development Report - Measuring Cost Per Lead & Cost Per Sale
With summer arriving and the economy opening up, it’s time to switch from recovery to growth. That’s why we’re offering this series of highlights from the 2021 Annual Franchise Development Report (AFDR). Click here for an overview of the research, analysis, and methodology used in the report.
Background
The results from the 2021 AFDR were unveiled last October at the first-ever Franchise Leadership & Growth Virtual Conference (FLGVC). New in this year’s report is survey data on the effects of the Covid-19 pandemic and new statistics on the changing role franchise brokers play in the development process. Because of Covid, the AFDR was combined with the Annual Franchise Marketing Report (AFMR) this year.
Participants in the survey consisted of franchisors that completed an in-depth online questionnaire. Responses were aggregated and analyzed to produce a detailed look into the recruitment and development practices, budgets, and strategies of a wide cross-section of franchisors. The data and accompanying commentary and analysis provide the basis of the 2021 AFDR/AFMR.
Highlights from the report were presented in a general session at the conference by Franchise Update Media’s EVP and Chief Content Officer Diane Phibbs and CEO Therese Thilgen. Ordering information is at the end of the article. Conference attendees received a complimentary copy.
Measuring cost per lead and cost per sale
Cost per lead and cost per sale are arguably the two most important metrics in franchise recruitment. Both increased this year. As we’ve noted in previous years, why 100 percent of franchisors don’t track these critical numbers remains a mystery – and a major reason many development departments continue to miss their annual goals.
“With 2020 being a crazy year for personal movement and economic uncertainty, it is no surprise that cost per lead and cost per sale are both up over last year,” said Phibbs. “You’re spending against your budget and the pandemic hits, causing an investment slowdown, so it’s natural that your cost per lead will go up.”
Something many brands considered as they budgeted for 2021 was to front-load their budgets, i.e., allocate a heavier portion of their annual spend to the first and second quarters, understanding that it takes time to move prospects through the sales funnel and sales process to get to a deal.
“I’d recommend that brands go back and take a look at front-loading their budget in 2021,” said Phibbs. “Because one of the stats we found in the research is that the lead-to-deal close window is now 18 weeks. That’s 4½ months, which means that leads will have to be generated by the beginning or middle of August to even have a chance of closing in 2021.”
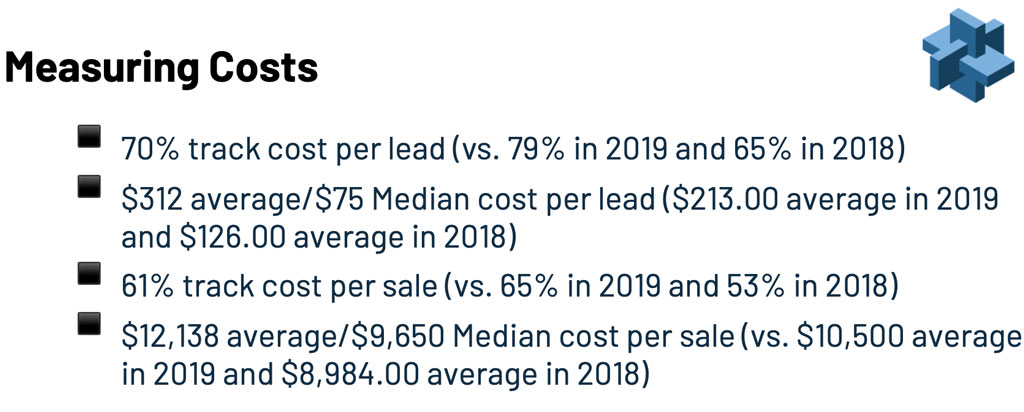
In this year’s AFDR, 7 in 10 (70%) of respondents tracked cost per lead; this compares with 79 percent in 2019 and 65% in 2018. The good news is that more brands are tracking cost per lead than they did years ago; the bad news, of course, is that 3 in 10 in this year’s survey still didn’t.
Average cost per lead (among those that tracked it) was $312; that compares with $213 in 2019 and $126 in 2018. Median cost per lead this year was $75, compared with $91 last year.
Looking at cost per sale, which many view as the most important recruitment metric, 61% of brands in the survey tracked this figure last year, compared with 65% in 2019 and 53% in 2018. While this shows strong improvement from a few years ago, it still means that almost 40% of brands still do not track this most valuable metric. In these pandemic times, with revenues down and so many brands struggling, you might think that tracking cost per lead would rise to the top of franchise recruitment teams’ to-do lists.
The 61% that did track cost per sale reported an average of $12,138, up significantly from 2019’s average of $10,500, and 2018’s average of $8,984. Median cost per sale was $9,650.
Next time: Sales closing ratios.
Ordering Information
As an additional bonus, the AFDR was combined with the Annual Franchise Marketing Report (AFMR) this year. The price for the combined report is $350. As noted, all conference attendees received a complimentary copy. Place orders at https://afdr.afrm.franchiseupdate.com.
Share this Feature


Recommended Reading:

| ADVERTISE | SPONSORED CONTENT |
FRANCHISE TOPICS
- Multi-Unit Franchising
- Get Started in Franchising
- Franchise Growth
- Franchise Operations
- Open New Units
- Franchise Leadership
- Franchise Marketing
- Technology
- Franchise Law
- Franchise Awards
- Franchise Rankings
- Franchise Trends
- Franchise Development
- Featured Franchise Stories

| ADVERTISE | SPONSORED CONTENT |


Franchising.com is produced by Franchise Update Media. Franchise Update Media has its finger on the pulse of franchising with unrivalled audience intelligence and market driven data. No media company understands the franchise landscape deeper than Franchise Update Media.
P.O. Box 20547
San Jose, CA 95160
PH. (408) 402-5681
 The franchise listed above are not related to or endorsed by Franchise Update or Franchise Update Media Group. We are not engaged in, supporting, or endorsing any specific franchise, business opportunity, company or individual. No statement in this site is to be construed as a recommendation. We encourage prospective franchise buyers to perform extensive due diligence when considering a franchise opportunity.
Copyright © 2001 - 2025. All Rights Reserved. Legal Notices | Privacy Policy


