2023 AFDR Highlights, Part 6: Brokers

Highlights from the 2023 Annual Franchise Development Report (AFDR) were unveiled at the Franchise Leadership & Development Conference (FLDC) in October.
Participants consisted of franchisors that completed an in-depth questionnaire online. Responses were aggregated and analyzed to produce a detailed look into the recruitment and development practices, budgets, spending allocations, and strategies of a wide cross-section of franchisors. The data and accompanying commentary and analysis provided the basis for the 2023 AFDR.
A total of 101 franchisors participated, representing 21,802 franchised units and 2,044 company-owned units. Despite predictions of a recessionary year ahead, participants plan to open a total of 1,725 new franchised units in 2023.
Highlights from the report were presented in an FLDC general session by Franchise Update Media EVP and Chief Content Officer Diane Phibbs and Wild Birds Unlimited Chief Development Officer Paul Pickett. Below is the fourth in a series of selected highlights. All conference attendees received a complimentary copy of the 2023 AFDR.
Brokers
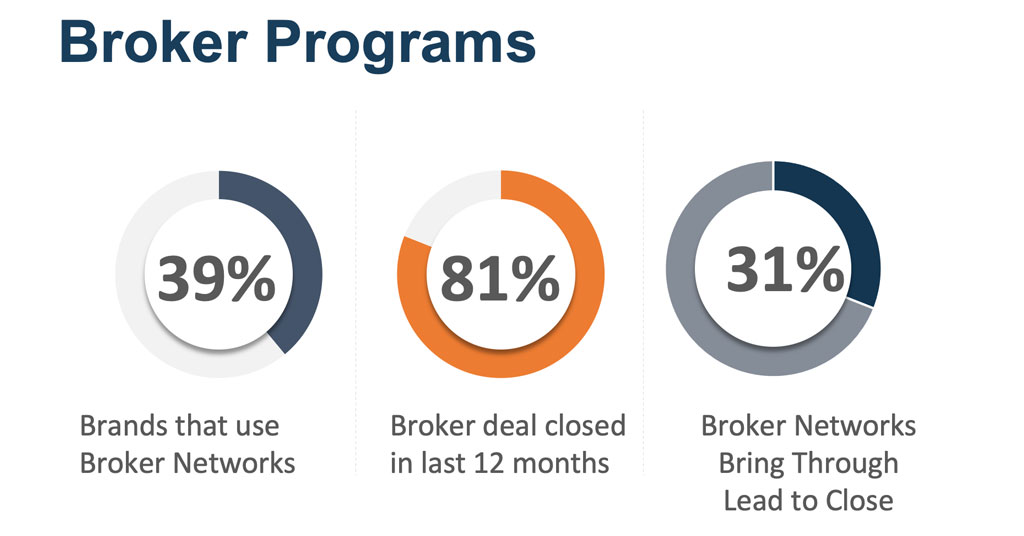
This is the third year the AFDR asked participants about brokers: if they used them, how much they paid, what results they found, and their plans to use them in the future. Four in 10 (39%) of brands in the survey used brokers, and 8 in 10 (81%) of them said they’d closed a deal through a broker in the past 12 months. Of those who used brokers, once they’d received a lead from a broker, 7 in 10 (69%) chose to take it from there and bring that lead through the sales process themselves.
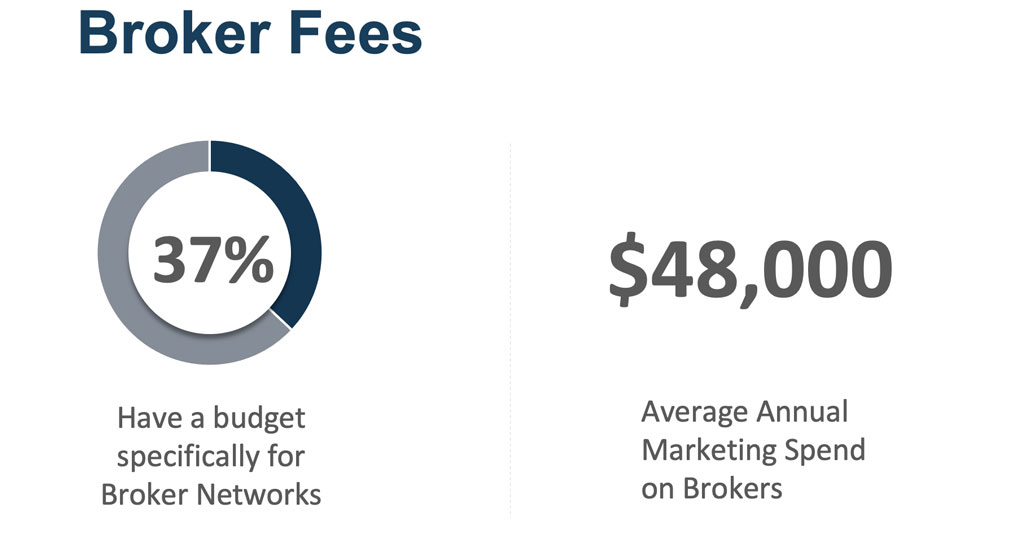
About 4 in 10 respondents (37%) said they had a budget allocated specifically for broker networks, and among those who used them, the average annual marketing spend on brokers this year was $48,000.
A new category this year, Measuring Broker Networks, asked the franchisors who used brokers which of the four following metrics they tracked:
• Territory check to close: 36%
• Lead to close: 73%
• Applications to close: 45%
• Discovery day to close: 45%
Results vary, of course, by brand, by sector, and by franchise fee—as well as by the relationship brands establish with the brokers they employ. Still, it’s no surprise that brokers specializing in franchising have a higher success rate than those who don’t. But there’s a price to pay for their services, often a steep one.
|
Use Brokers |
Don’t Use Brokers |
|
|---|---|---|
|
Average cost per lead |
$295 |
$155 |
|
Average cost per sale |
$13,870 |
$10,086 |
We plan to continue digging further into the role and success rate of brokers in future AFDRs, our magazines, and our newsletters in 2023.
Next month, last in the series: Franchisors exceeding goals
Share this Feature


Recommended Reading:

| ADVERTISE | SPONSORED CONTENT |
FRANCHISE TOPICS
- Multi-Unit Franchising
- Get Started in Franchising
- Franchise Growth
- Franchise Operations
- Open New Units
- Franchise Leadership
- Franchise Marketing
- Technology
- Franchise Law
- Franchise Awards
- Franchise Rankings
- Franchise Trends
- Franchise Development
- Featured Franchise Stories

| ADVERTISE | SPONSORED CONTENT |


Franchising.com is produced by Franchise Update Media. Franchise Update Media has its finger on the pulse of franchising with unrivalled audience intelligence and market driven data. No media company understands the franchise landscape deeper than Franchise Update Media.
P.O. Box 20547
San Jose, CA 95160
PH. (408) 402-5681
 The franchise listed above are not related to or endorsed by Franchise Update or Franchise Update Media Group. We are not engaged in, supporting, or endorsing any specific franchise, business opportunity, company or individual. No statement in this site is to be construed as a recommendation. We encourage prospective franchise buyers to perform extensive due diligence when considering a franchise opportunity.
Copyright © 2001 - 2025. All Rights Reserved. Legal Notices | Privacy Policy


