2013: Performance Required: It's Not What You Say, It's What You Do--And Measure!
You can't improve what you don't measure, the old saying goes... which is one reason so many in franchising eagerly anticipate the release of the Annual Franchise Development Report (AFDR) at Franchise Update Media Group's annual Leadership & Development Conference. Things change from one year to the next, in life and in franchising, and the AFDR provides franchise sales and development executives an annual benchmark of best practices, along with a slew of other development-related data and analysis.
This year's survey gathered data on sales and recruitment practices from 106 franchisors representing 43,497 units (34,566 franchised and 8,931 company-owned). Participants consisted of franchisors who registered for the annual conference in Atlanta and filled out a lengthy survey online in advance. The responses--analyzed to provide an in-depth view into the recruitment and development practices, budgets, and strategies of a wide cross-section of franchisors--provide the basis of the AFDR.
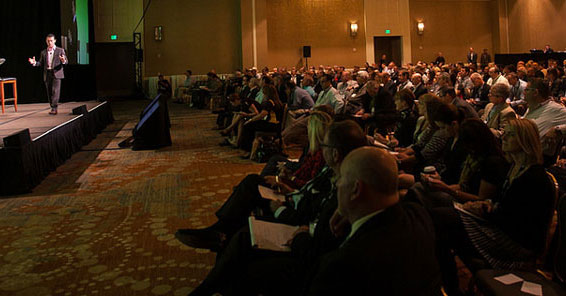
"Today performance is required. You're out of the race unless you're growing forward," said Steve Olson, president of Franchise Update Media Group, who presented the results to a general session of about 350 franchise sales and development executives at the conference in early October, where the theme was "Winning the Race".
Growth plans for 2013 among the 106 respondents target a total of 4,675 additional franchised units from 3,095 franchisees. That compares with 8,262 new franchise units and 4,441 new franchisees last year (from 110 franchisors), and with 3,850 new units from 3,100 franchisees in 2010 (from 126 franchisors).
To hit those goals, says Olson, franchisors will have to provide a compelling business opportunity, which features strong unit economics, transparency in Item 19 (including costs, as well as sales numbers), and a supportive culture that today's quality buyers are looking for in a franchise system. The following is a high-level summary of some of the in-depth findings from the 2013 AFDR. To order a copy of the complete report, Click Here
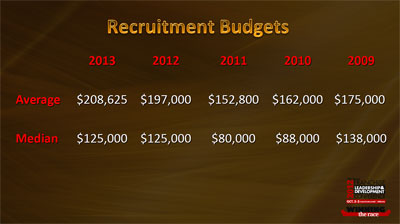
- Recruitment budgets. On the whole, 2013 median recruitment budgets are holding steady with those in 2012, at $125,000. While median recruitment budgets for the past two years are above the $80,000 recorded in 2010 and 2011, they are still below the $138,000 in 2008 and 2009. Average recruitment budgets continued to rise, following a drop in 2010 and 2011.
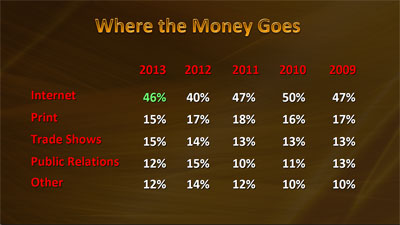
- Â Where the money goes. The distribution of development spending has remained fairly steady over the past 5 years or more. Internet spending is projected to rise in 2013 to 46 percent, returning to its historical levels after falling to 40 percent in 2012. One likely reason is the increase in quality prospects from Internet sources, following the consolidation of portals, as well as improved SEO on brand websites, better designed franchising websites, and the continuing increase in buyers using the Internet for researching brands. "In today's environment, it's all about generating applications from quality prospects," says Olson. "That's the benchmark, not inquiries and leads. Especially with the funding concerns in franchising today, why waste your time?"
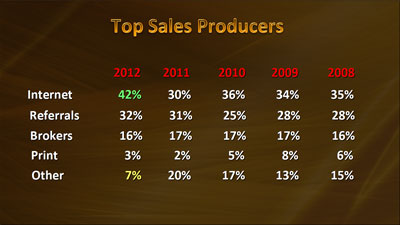
- Â Top sales producers. The Internet, at 42 percent, regained its top standing among sales channels in 2012 after dipping into second place (behind referrals) in 2011, following years of ascendancy. Referrals, at 32 percent, placed second, remaining about the same as 2011. Brokers, at 16 percent, remained about the same as in the past 5 years. Print, at 3 percent, was up slightly, but still below its historical levels. "Where the money goes is interesting, but it's all about what vehicle or channel is generating the deals," says Olson. "Franchisors, after heavy experimentation, are going back to traditional sources. Social media is 'traditional' now, no longer the new kid on the block. Now it's about trying to figure out how to make it work."
- Top Internet sales producers. In a surprise to many, portals showed a "significant bounceback from previous years" as a sales producer in the most recent survey, says Olson, jumping from 32 percent in 2011 to 43 percent in 2012. An indication that franchisors are improving at tracking the results of their Internet spend, the percentage of those answering "Don't know" and "Other," at 8 percent and 7 percent respectively, continue to fall or remain much lower than in preceding years. "It's really about ongoing optimization and ad portals," says Olson. And although pay-per-click and social media showed a lower return per budget expenditure (consistent with previous years), "There are certain franchises where pay-per-click does work," he said.
- Â Online alternative resources. While sales originating from "alternative" online sources (as opposed to company websites and portals) continue to remain low as a percentage of total franchise sales, the good news is their numbers also continue to rise from previous years. Respondents from 14 franchise companies reported 46 sales in this category: Facebook, 19; LinkedIn, 11; YouTube, 9; Craigslist, 4; and blogging, 3. One unexpected observation: since the survey began measuring social as a sales source, Craigslist has made the list every year. Olson compared using Craigslist to placing a classified ad--relatively simple, inexpensive, and available 24 hours a day. As for using social media as a franchise sales tool, he says, "Everybody's interested in it, but the cautionary note is that this is not a recruitment source for most franchisors to count on. It is great for brand engagement, and can be a much better resource for the retail side of your business."
- One-to-one marketing. This is a new category for the AFDR, as the concept of one-to-one marketing makes its way into the franchise development toolbox. Calling it "the new kid on the recruiting block," and "today's newest recruiting source," Olson notes that 40 of the franchisors surveyed have tried it, with 22 generating sales. "It started on the consumer side, drawing more new customers to different chains. So is it going to work for recruitment?" Because one-to-one marketing tools provide hundreds of customizable variables, allowing micro-targeting of an exact household or individual, franchisors are now applying them to find new prospects in local markets. "If 55 percent of 40 franchisors have done a deal, it is really something that franchisors must consider," says Olson. "It's a low-cost lead generator compared with other media. It's no magic bullet, but it's worth a try." SLIDE 9
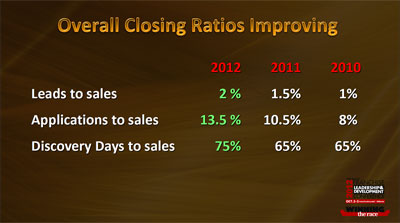
- Overall closing ratios noticeably jumped across the board this year, compared with the two previous years. At 2 percent, the ratio of leads to sales increased from 1.5 percent in 2011 and 1 percent in 2010, gains of 50 percent and 100 percent, respectively. "For franchise closing rates, the recession is definitely over," says Olson. "The increase to 2 percent represents a return to traditional, pre-recession numbers. As we know, the challenge is continuing to find more funding sources." The ratio of applications to sales is on a steady upswing, rising from 8 percent in 2010 to 10.5 percent in 2011 and to 13.5 percent in 2012. Olson calls this a dramatic increase from 2 years ago. The ratio of discovery days to sales has climbed to 75 percent, up from 65 percent in the previous 2 years, which Olson said was the benchmark in pre-recession days. "Best practices companies continue to elevate their performance standards as they move into 2013 recruitment. There's definitely a new, widening gap between the winning and losing brands in the development race. Franchisors that don't wake up are headed for disaster." SLIDE 10
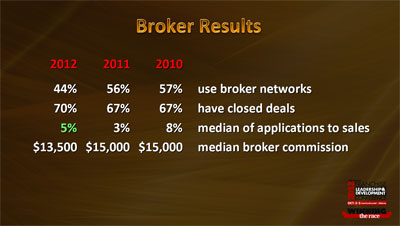
- Â Brokers. The numbers on the use of brokers by this year's survey participants are mixed. The number of respondents using broker networks declined to 44 percent (from 56 percent in 2011 and 2010). However, the number of those closing deals through brokers rose to 70 percent, from 67 percent in the two preceding years; and the median broker commission of $13,500 dropped from the $15,000 reported in the past two years. The median of applications to sales (5 percent) was up from 3 percent in 2011, but lags the 8 percent reported in 2010. Two ongoing advantages in working with brokers: 1) with budgets still tight, franchisors don't need to invest as much up front, and 2) brokers bring in additional qualified buyers franchisors would never have gotten otherwise. SLIDE 11
- Profiling tools. Almost half (48 percent) of franchisors reported that profiling tools have helped increase the quality of their new franchisees. That compares with about 20 to 30 percent of franchisors using profiling tools just a few years ago. This is good news in a time when vetting candidates is more critical. An additional one in four (23 percent) are also using profiling tools, but say it's too soon to report the results. That leaves three in 10 (29 percent) not currently using profiling tools to screen and evaluate new franchisees. Using these tools, says Olson, "provides a definite edge to franchisors in getting the right buyers. They're better quality, better cultural matches, and produce better unit economics."
- Younger buyers on the rise. As the economy continues to move ahead slowly and the unemployment rate remains high, franchisors are seeing larger numbers of younger people looking at franchising opportunities. Fifty percent reported they have franchisees in their 20s, and 97 percent have owners in their 30s. "We're seeing younger buyers than ever," says Olson. "I expect we'll see a lot of growth in the younger generation in the coming years." These buyers, he says, are often out of college, have no jobs, and are getting financing help from their parents. Franchisors, he recommends, should examine this newer market if they haven't yet, to see if there's a fit for their opportunity. SLIDE 13
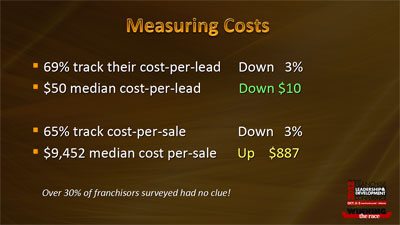
- Â Measuring costs. Surprisingly in this age of data, metrics, and increased use of technology for tracking spending, the numbers of those who track cost per lead (69 percent) and cost per sale (65 percent) both fell about 3 percent from last year. "Thirty to 35 percent of those surveyed still don't know!" says Olson. "They haven't a clue as to what's working. It's like being in the boxing ring blindfolded." If they keep this up, he adds, they'll get knocked out. As for costs, the $50 median cost per lead is down $10 from the previous year, but the median cost per sale rose $887 to $9,452. Finally, he says, in a time of tight budgets and a pool of cautious applicants, you must measure your marketing ROI. "You will save thousands of dollars per year by determining where your best sales sources are. Too many companies continue to base their advertising buys on cost per lead."
- Referrals. About six of 10 (58 percent) reported that referrals have the highest close ratios of all lead generation sources. This is both good news and bad. "What this means is for 42 percent of franchisors, referrals do not generate their highest closing ratios. That signals likely trouble for some of these brands that have challenges with their franchisee validation, which scares away buyers," says Olson. Calling this "the great divide," he sees two separate camps evolving among franchisors: those who are accelerating growth by building team cultures, holding everyone accountable, and who have developed high franchisee satisfaction; and the others, who are failing to break through critical barriers that jeopardize their future expansion. "They're either growing or they're going. If you're not generating referrals, you have a problem--or if you're generating referrals and it's not generating sales, you have a problem." Further findings: six of 10 (61 percent) respondents offer some type of incentive to franchisees for prospects that sign up, and the median referral fee of $3,500 remained about the same as 2011.
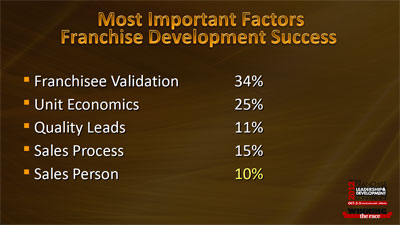
- Factors in development success. In an open-ended question, this year's AFDR survey asked participants to list the most important factors in franchise development success. Franchisee validation was listed by one in three (34 percent), followed by unit economics at 25 percent, a strong sales process at 15 percent, quality leads at 11 percent, and the sales person at 10 percent. Commenting on the results, Olson cautioned about a possible over-reliance on the many excellent sales automation tools franchisors are using. "I sometimes find franchisors can become too dependent on the technology to do the sales person's work. Technology can't sell deals, people do. Technology by all means helps, but don't depend on it to compensate for a sales person's poor performance--because it can't."
- Start-up costs. No surprise: they're down this year. Four in 10 (41 percent) of franchisors in the survey reduced startup fees in 2012. Among that 41 percent, seven in 10 (69 percent) lowered the investment amount, one in four (23 percent) reduced the franchise fee, and one in 12 (8 percent) lowered the royalty fee. While this might be bad news for franchisors, it's great news for franchisees. "The continuation of this trend makes this the best time ever for new and existing franchisees to buy because of the ongoing incentives, the commitment to better unit economics, improved support services, lowering startup costs through smaller footprints and build-outs, and better deals available with suppliers," says Olson."
- Franchise sales performance. Goals (and expectations) are tricky: franchisors must set them, but with so many variables to consider it's a combination of the science of metrics, economic forecasting, and some art. Overall, 50 percent of respondents met or exceeded their goals in 2012: 34 percent met their goals and 16 percent exceeded them.
- Franchisors exceeding goals by category. Two sectors--food and service--stood out by exceeding their goals in 2012, food brands by 24 percent and service brands by 16 percent. Retail brands in the survey also exceeded expectations, by 7 percent, while retail food brands hit their goals, but did not exceed them.
- Franchisors exceeding goals. What makes franchisors excel? We can find good clues among those who exceeded their goals in 2012. Nine in 10 (88 percent) have higher budgets allocated toward achieving their goals. Three in four (73 percent) provide FPRs. One in three (33 percent) increased their sales staff. All reported that conditions are good or neutral at the unit level. Seven in 10 (69 percent) said leads were up over 2011. Their median cost per sale of $5,000 was just 53 percent of the median cost reported for all respondents ($9,452, see above). They also pay higher sales commissions and bonuses, which clearly helps them attract a stronger sales team. Finally, four in 10 among this group of "excellers" are former franchisees; food for thought when building a sales team.

2013 AFDR AVAILABLE NOW!
The AFDR, the only sales and lead generation benchmark report available in franchising, identifies industry sales trends and top lead generation sources for meeting sales goals. For example:
The 2013 AFDR is packed with timely information and benchmarking data that can help your franchise system grow faster and close more deals--while saving thousands of dollars in cost per sale. Based on in-depth surveys from 106 franchise organizations, this thoroughly researched report reveals the franchise success drivers that are sure to boost the output and quality of your sales department. Filled with the most comprehensive sales and lead generation data in franchising, the 2013 AFDR is a must-buy tool for franchisors, development consultants, and advertising and marketing suppliers, and is ideal for benchmarking and building budgets and media plans. The complete report, with analysis and benchmarks, is available now for $399. For ordering information, call Sharon Wilkinson at 800-289-4232 x202, email to [email protected], or go to www.franchising.com/franchisors/afdr.html. |
 The 2013 Annual Franchise Development Report (AFDR) delivers data collected from 106 franchisors representing 43,497 units, with responses organized by industry, unit investment, system-wide sales, and more. The annual report provides franchisors with the ideal tool for studying their own development practices, benchmarking their sales and recruitment budgets against their own industry categories, and setting goals and budgets for the coming year. The report also includes research into online recruitment practices, the growing use of mobile and social tools by prospects, and best practices by franchisors.
Share this Feature


Recommended Reading:

FRANCHISE TOPICS
- Multi-Unit Franchising
- Get Started in Franchising
- Franchise Growth
- Franchise Operations
- Open New Units
- Franchise Leadership
- Franchise Marketing
- Technology
- Franchise Law
- Franchise Awards
- Franchise Rankings
- Franchise Trends
- Franchise Development
- Featured Franchise Stories
FEATURED IN
Franchise Update Magazine: Issue 4, 2012


Franchising.com is produced by Franchise Update Media. Franchise Update Media has its finger on the pulse of franchising with unrivalled audience intelligence and market driven data. No media company understands the franchise landscape deeper than Franchise Update Media.
P.O. Box 20547
San Jose, CA 95160
PH. (408) 402-5681
 The franchise listed above are not related to or endorsed by Franchise Update or Franchise Update Media Group. We are not engaged in, supporting, or endorsing any specific franchise, business opportunity, company or individual. No statement in this site is to be construed as a recommendation. We encourage prospective franchise buyers to perform extensive due diligence when considering a franchise opportunity.
Copyright © 2001 - 2025. All Rights Reserved. Legal Notices | Privacy Policy


