2019 AFDR: How Do You Measure Up?
Benchmark your recruitment against 100+ brands
Results from the 2019 Annual Franchise Development Report (AFDR) were unveiled in late October at the 20th annual Franchise Leadership & Development Conference (FLDC). The 2019 AFDR is based on responses from 109 franchisors representing 34,058 units (26,838 franchised and 7,220 company-owned).
Participants in the survey consisted of franchisors that completed an online questionnaire. Responses were aggregated and analyzed to produce a detailed look into the recruitment and development practices, budgets, and strategies of a wide cross-section of franchisors. The data and accompanying commentary and analysis provide the basis of the 2019 AFDR.
Highlights from the report were presented in a general session at the conference by Franchise Update Media's EVP and Chief Content Officer Diane Phibbs. Other aggregated high-level observations gleaned from this year's survey included:
- 710 domestic locations transferred
- 327 franchises sold 45 days before close of the survey
- 288 franchises sold through brokers in the past 12 months.
For 2019, growth plans among the 109 respondents are targeting a total of 3,617 additional franchise units. This compares with the previous year's target of 5,990 additional franchise units from 142 respondents.
Below are additional highlights from the 2019 AFDR. Ordering information can be found on page 33. (Conference attendees receive a complimentary copy.)
- Recruitment budgets. Average 2019 budget plans for franchise sales and recruitment (advertising and media expenses, not including brokers and employee compensation) among respondents was $186,818, with a median of $120,000. This is a decrease from last year, where the corresponding numbers were $202,462 and $140,000. While the budget numbers are down, they remain well within the range of planned spending during the previous 5 years.
| Recruitment Budgets | ||||||
|---|---|---|---|---|---|---|
|
2019 |
2018 |
2017 |
2016 |
2015 |
2014 |
|
|
Average |
$186,818 |
$202,462 |
$181,510 |
$162,821 |
$166,693 |
$201,817 |
|
Median |
$127,000 |
$140,000 |
$125,000 |
$120,000 |
$100,000 |
$120,000 |
- Where the money goes. With the increased emphasis on and steady shift to online recruitment methods, the AFDR continued reporting on a new metric introduced last year: breaking out spending on franchise websites and social media from the "digital" category total. Adding spending on franchise websites (14 percent) and social media (12 percent) back in shows a total of 58 percent of overall digital spend, an increase from last year's 52 percent. To provide finer granularity, we also continued tracking three new categories from last year--direct mail, in-market meetings, and TV/radio--which significantly reduced the "Other" category. Spending on print (8 percent) and trade shows (14 percent) was down slightly from 2018, while spending on public relations (13 percent) remained essentially the same as in the past 6 years. In sum, recruitment spending is balanced and spread across multiple marketing methods and channels.
| Where the Money Goes | |||||||
|---|---|---|---|---|---|---|---|
|
2019 |
2018 |
2017 |
2016 |
2015 |
2014 |
2013 |
|
|
Digital |
32% |
30% |
49% |
48% |
44% |
45% |
46% |
|
|
8% |
10% |
11% |
10% |
13% |
15% |
15% |
|
Direct Mail |
2% |
2% |
|
|
|
|
|
|
Trade Shows |
14% |
17% |
17% |
18% |
16% |
16% |
15% |
|
Public Relations |
13% |
11% |
13% |
14% |
12% |
12% |
12% |
|
Other |
2% |
3% |
10% |
10% |
15% |
12% |
12% |
|
Franchise Website |
14% |
12% |
|
|
|
|
|
|
Social Media |
12% |
10% |
|
|
|
|
|
|
In Market Meetings |
3% |
4% |
|
|
|
|
|
|
TV/Radio |
1% |
2% |
|
|
|
|
|
- Where the digital money goes. As digital spending continues to account for an increasing percentage of recruitment budgets, franchisors were asked to break out their digital spending by category. Last year, as with overall digital spending (above), we added new categories that used to be included in other numbers: franchise opportunity sites (25 percent), social media advertising (11 percent), and digital asset creative (4 percent)--making direct comparisons with previous years more difficult, but also providing a deeper look into where development budgets are headed. This year we added another new category: Sponsored Content/Native Advertising (5 percent). Breaking out these categories reduced the "Other" category to a mere 2 percent, which compares with 4 percent in 2018 and 8 percent in 2017. Brands are becoming more aware of where they're spending their money on digital.
| Where the Digital Money Goes | ||||
|---|---|---|---|---|
|
|
2019 |
2018 |
2017 |
2016 |
|
Franchise Opportunity Sites |
25% |
22% |
33% |
33% |
|
Other Business Media |
2% |
4% |
8% |
X |
|
Pay-per-click |
24% |
15% |
19% |
18% |
|
Search Engine Optimization |
9% |
10% |
13% |
12% |
|
Email Marketing |
8% |
7% |
9% |
9% |
|
Social Networking |
6% |
6% |
11% |
12% |
|
Re-Marketing / Target Trailing |
5% |
7% |
8% |
7% |
|
In Market Meetings |
3% |
4% |
|
|
|
Social Media Advertising |
11% |
12% |
|
|
|
Digital Asset Creative |
4% |
3% |
|
|
|
Social Media Advertising |
5% |
|
|
|
- Top sales producers. After taking the lead in 2012 as the top sales producer, digital took a hit in 2017, dropping from a remarkably steady 42 percent to just 31 percent. But for 2018 it rose to nearly half, at 47 percent. Yet, even with the growing reliance on digital, attribution remains uncertain. Where did the prospect who contacted the brand online begin their journey? Did they read a print article? See a television commercial? Hear a radio ad? See a billboard? Use the product or service and liked what they saw? As Phibbs put it at last year's FLDC, "Where do they learn about the brand before they fill out the form on your website?" And while these percentages represent the #1 categories named by respondents as sales producers, she noted, "If you look at a weighted score of how franchisors ranked each category, digital comes out on top, with referrals, print, PR, trade shows and brokers all very close in rankings." A big difference from previous years is referrals--still considered the strongest source of high-quality leads--which rose from about 30 percent in 2016 to 43 percent in 2017, but tumbled to 28 percent in 2018, in line with most previous years. "The good news," noted Phibbs, "is that everything's working to some extent."
| Top Sales Producers | |||||||
|---|---|---|---|---|---|---|---|
|
|
2018 |
2017 |
2016 |
2015 |
2014 |
2013 |
2012 |
|
Digital |
47% |
31% |
42% |
42% |
42% |
42% |
42% |
|
Referrals |
28% |
43% |
30% |
27% |
30% |
31% |
32% |
|
Brokers |
7% |
14% |
12% |
15% |
16% |
17% |
16% |
|
|
0% |
0% |
2% |
3% |
3% |
0% |
3% |
|
Other |
7% |
7% |
8% |
7% |
9% |
10% |
7% |
|
Trade Shows |
2% |
1% |
5% |
4% |
N/A |
N/A |
N/A |
|
Public Relations |
5% |
4% |
1% |
2% |
N/A |
N/A |
N/A |
- Top digital sales producers. Respondents were asked to segment their digital spending as it relates to sales. No major changes here from previous years, other than a drop in SEO to 16 percent, its lowest percentage since 2013 (when it was an usually high 49 percent before settling into an average of 22.5 percent for 2014-2017). Sponsored content, a new category this year, accounted for 3 percent of digital sales. Portals, after a slight decline last year, returned to their average range of the previous 3 years to account for 1 in 3 sales. Remarketing as a digital sales source rose slightly. And at 9 percent, email marketing remained close to last year's 10 percent, up from 4.5 percent 2015 and 6 percent in 2016. Phibbs noted that, as in the previous slide, a look at the weighted scores shows the rankings more balanced. Yet even in this age of extreme data, more than 1 in 10 respondents (12 percent) still checked off "Other" or "Don't Know," down from 21 percent last year, and slightly lower than the preceding years. Again, it may be worth looking into attribution. For brands that don't know where more than 1 in 10 of their digital sales came from, there's room for improvement.
| Top Digital Sales Producers | ||||||
|---|---|---|---|---|---|---|
|
|
2018 |
2017 |
2016 |
2015 |
2014 |
2013 |
|
Digital Franchise Ad Portals |
33% |
26% |
32% |
33% |
35% |
23% |
|
Search Engine Optimization |
16% |
20% |
22% |
24% |
24% |
49% |
|
Pay-Per-Click |
15% |
13% |
16% |
15% |
15% |
6% |
|
Social Advertising |
6% |
7% |
5% |
4.5% |
4% |
4% |
|
Remarketing |
5% |
2% |
4% |
4.5% |
4% |
N/A |
|
Email Marketing |
9% |
10% |
6% |
4.5% |
N/A |
N/A |
|
Other |
6% |
9% |
9% |
9.5% |
12% |
5% |
|
Don't Know |
6% |
12% |
5% |
5% |
6% |
11% |
|
Sponsored Content |
3% |
|
|
|
|
|
- Measuring costs. Both average cost per lead and average cost per sale rose in 2018. Nearly 2 of 3 respondents (65 percent) said they track cost per lead, up slightly from 61 percent last year, and 56 percent the year before--so steady improvement there. Yet as franchise consultant Steve Olson is quick to point out, this also means that 1 in 3 brands still do not track cost per lead. And if you look at the 53 percent who track cost per sale, it means nearly half of respondents didn't know what their cost per sale was--perhaps the most critical number in franchise development metrics. As we noted last year, "With all due respect to franchise sales teams, are you kidding?" And to further repeat last year's observations, franchise recruitment experts continue to shake their heads at the number of franchise sales teams that set a budget, spend the money, and fail to measure the effectiveness of that effort and spend. Why 100 percent of brands don't track these critical metrics remains a mystery--and could be one reason that so many development departments continue to miss their annual sales goals (see below). Among the two-thirds who do track these numbers, the average cost per lead reported in this year's survey was $126, up from last year's $112 and the previous year's $109. And the average cost per sale of $8,984 edged up slightly from $8,571 in 2017 (up from $7,558 in 2016 and $6,300 the year before).
| Measuring Costs |
|---|
|
- Sales closing ratios. The three most important metrics in evaluating the effectiveness of a franchise development team are the ratios of leads to sales, applications to sales, and discovery days to sales. All three ratios this year were within range of those from the previous 6 years. However, this year we made a change in the leads-to-sales question, specifying "qualified leads," not all leads. This explains the huge increase to 14 percent from previous years, which were nearly all in the 2 to 3 percent range. This higher closing ratio speaks to the importance of having a pre-qualifier working at the front end of your sales process. Weeding out the more "iffy" leads on the front end saves the sales team a lot of wasted time and effort during the ensuing stages of the sales process. And, noted Phibbs, "With the number of leads going down and the applications and discovery days to sales ratios increasing, it looks like we're reaching the right target audience."
| Sales Closing Ratios | |||||||
|---|---|---|---|---|---|---|---|
|
|
2018 |
2017 |
2016 |
2015 |
2014 |
2013 |
2012 |
|
Leads to Sales |
Qualified 14% |
1.8% |
2% |
3% |
7% |
2% |
2% |
|
Applications to Sales |
23% |
26% |
20% |
18% |
27% |
20% |
13.5% |
|
Discovery Days to Sales |
71% |
72% |
63% |
61% |
67% |
77% |
75% |
- Franchisors exceeding goals. Unlike last year, where brands exceeding their sales goals spent more on cost per lead than the average ($128 vs. $112), this year's "exceeders" spent significantly less ($72 vs. $126). When it came to cost per sale, brands that exceeded their goals spent less than half of the average ($3,974 vs. $8,984). They also exceeded the average ratios for applications to sales (39 percent vs. 23 percent) and discovery days to sales (83 percent vs. 71 percent). Among other things, these numbers indicate that franchisors exceeding their goals are much more efficient in their recruitment spending than the average. In short, the better performers are spending less and getting better results. This table shows the results of the top performers compared with the average for all survey participants.
| Franchisors Exceeding Goals | ||
|---|---|---|
|
|
2018 |
2017 |
|
Cost per lead |
$72 (avg. $126) |
$128 (avg. $112) |
|
Cost per sale |
$3,974 (avg. $8,984) |
$6,398 (avg. $8,571) |
|
Applications-to-sales ratio |
39% (avg. 23%) |
31% (avg. 26%) |
|
Discovery day-to-sales ratio |
83% (avg. 71%) |
79% (avg. 72%) |
By segment, food brands exceeding their goals (27 percent) dropped precipitously from previous years. Possible explanations include oversaturation of the domestic market for fast food brands, changing consumer preferences for healthier fare, and the spate of mergers and acquisitions resulting in consolidation. It also could explain why so many U.S. food brands are looking overseas for growth. The segment that fared best by far was investments above $250,000, where 3 out of 4 (77 percent) brands exceeded their goals. Brick-and-mortar services exceeding their goals fell from the previous 2 years, while services based on territory/population doubled from the previous 3 years. A comparison of the "exceeders" by industry segment, reveals the following:
| Segment | 2018 | 2017 | 2016 | 2015 |
|---|---|---|---|---|
|
Food |
27% |
40% |
44% |
59% |
|
Retail non-food |
13% |
5% |
9% |
11% |
|
Service (brick and mortar) |
20% |
25% |
30% |
15% |
|
Service (territory/population) |
20% |
10% |
9% |
11% |
|
Retail food |
20% |
20% |
9% |
4% |
|
Investment per unit > $250,000 |
77% |
63% |
57% |
71% |
7 Differentiators
The following are seven of the most important things the more successful brands have seen or done in their franchise recruitment and development that helped them rise above the competition:
- Lower average cost per lead and cost per sale
- 75 percent reported the quality of their leads is up
- Higher conversion rate of qualified leads, applications, and discovery days to close
- Shorter time to deal close (10 weeks)
- 93 percent described unit-level business conditions as good (69 percent of franchisors below their goals described business conditions as good)
- Use multiple marketing vehicles
- Fewer resales (50 percent fewer than franchisors below their goals)
"They have a strategy. They know where they want to grow, who their target customer is, and how to reach them," said Phibbs.
In addition, she pointed to the importance of unit-level business conditions as a factor in how today's top-performing brands differentiate themselves from the competition. "Locations that aren't doing well can lead to transfers and closures. Surveys of multi-unit franchisees tell us that transfers and closures can be deal killers or red flags for them," said Phibbs. "If this is happening in your system, I'd suggest you have a conversation with your partners in operations and marketing right away. Get the brand on board to improve unit-level conditions before they kill your growth."
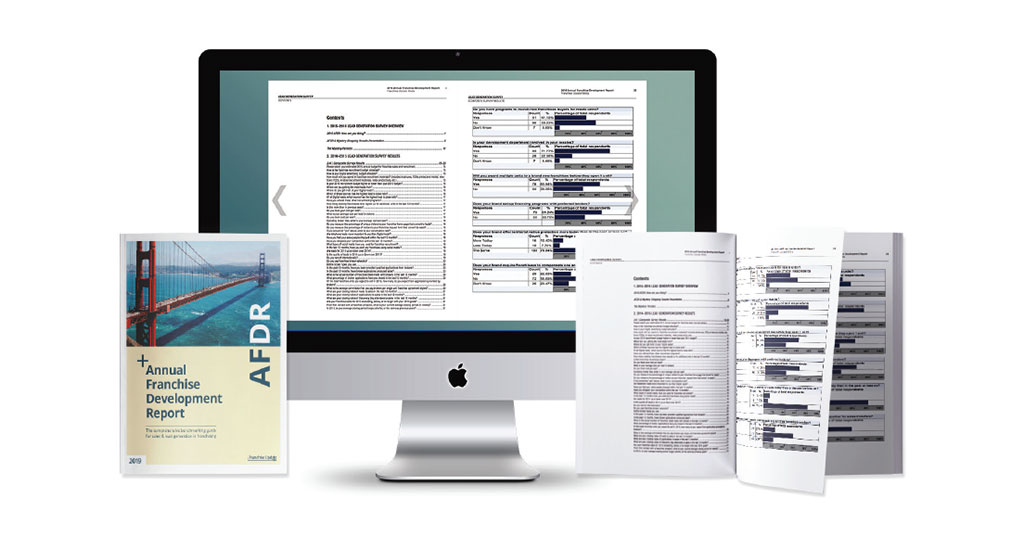
2019 AFDR Now Available!
The 2019 Annual Franchise Development Report (AFDR) delivers data collected from 109 franchisors representing 34,058 units, with responses organized by industry, unit investment, system-wide sales, and more. The annual report provides franchisors with the ideal tool for studying their development practices, benchmarking their sales and recruitment budgets against their own industry categories, and setting goals and budgets for the year ahead. The report also includes research into online recruitment practices, the growing use of mobile and social tools by prospects, and best practices by franchisors.
The AFDR, the only sales and lead generation benchmark report available in franchising, identifies industry sales trends and top lead generation sources for meeting sales goals. For example:
- How does your sales budget compare with other brands in your segment?
- Are your closing ratios in line with your industry and investment level?
- What conversion rates should you expect from your website?
- Is your online spending paying off? How do you know?
- Are your brokers delivering--and is their price per deal too high?
- Are you using referrals, and how much are you paying for them?
- How are franchisors using social media to recruit candidates?
- Some franchisors are exceeding their sales goals. What are they doing differently from those falling short?
The 2019 AFDR is packed with timely information and benchmarking data that can help your franchise system grow faster and close more deals--while saving thousands of dollars in cost per sale. Based on in-depth surveys from 109 franchise companies, this thoroughly researched report reveals the success drivers that are sure to boost the output and quality of your sales department.
Filled with the most comprehensive sales and lead generation data in franchising, the 2019 AFDR, at more than 250 pages, is a must-buy tool for franchisors, development consultants, and advertising, marketing, and technology suppliers--and is ideal for benchmarking and building budgets and media plans.
The complete 2019 AFDR, with analysis and benchmarks, is available for $350. For ordering information, go to https://afdr.franchiseupdate.com or email your questions to [email protected].
Share this Feature


Recommended Reading:

FRANCHISE TOPICS
- Multi-Unit Franchising
- Get Started in Franchising
- Franchise Growth
- Franchise Operations
- Open New Units
- Franchise Leadership
- Franchise Marketing
- Technology
- Franchise Law
- Franchise Awards
- Franchise Rankings
- Franchise Trends
- Franchise Development
- Featured Franchise Stories
FEATURED IN
Franchise Update Magazine: Issue 4, 2018


Franchising.com is produced by Franchise Update Media. Franchise Update Media has its finger on the pulse of franchising with unrivalled audience intelligence and market driven data. No media company understands the franchise landscape deeper than Franchise Update Media.
P.O. Box 20547
San Jose, CA 95160
PH. (408) 402-5681
 The franchise listed above are not related to or endorsed by Franchise Update or Franchise Update Media Group. We are not engaged in, supporting, or endorsing any specific franchise, business opportunity, company or individual. No statement in this site is to be construed as a recommendation. We encourage prospective franchise buyers to perform extensive due diligence when considering a franchise opportunity.
Copyright © 2001 - 2025. All Rights Reserved. Legal Notices | Privacy Policy


