The Profit Mastery Road Map: Improve Your Profitability and Cash Flow
Mysteries are solved when we use clues to find the culprits behind the crime. Financially speaking, when the crime results in the untimely demise of a business, we often see three usual suspects: low cash, low gross margin, and low net margin.
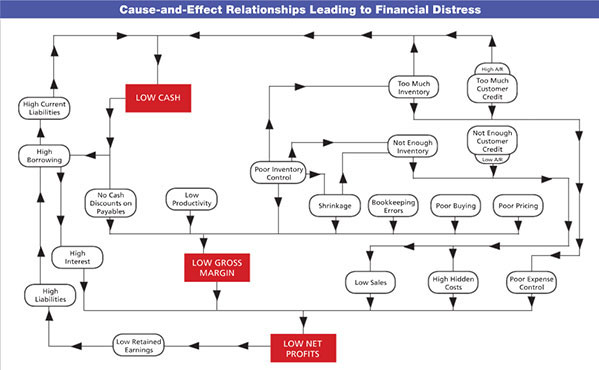
But low cash and low margins are caused by something. The diagram presents a big picture overview, but also can lead us through a clue-by-clue, cause-and-effect deductive analysis designed to pinpoint potential financial culprits. When combined with industry benchmarks, this diagram can become your personal roadmap to success.
First, how to read it. Between any two boxes, in the direction of the arrows, insert the word "causes." In other words, "low cash" causes "high borrowing." Now, if you work against the arrows, include the words "is caused by" between the two boxes. For example, "high interest" is caused by "high borrowing." Gross margin is highlighted for a reason: without an adequate margin (long term), you might as well close up shop.
Start at "low cash" and take it in all directions until you've traveled all through the system. Many people view financial problems or issues as isolated occurrences. One of the primary benefits of this financial cause-and-effect diagram is to highlight the interdependent nature of the financial system in your business. The key here is interdependence.
Let's join our case study client, John Thomas of Thomas Rentals, at the "scene of the crime." John does about 55 percent of his business in construction equipment rental. Although his sales were up in 2013, John ended making less money than he did in 2012. At one point, John confessed that he was forced to get an emergency line of credit from his bank. As his personal private eye, we can use the roadmap to help John do a little detective work to figure out where he went wrong.
We'll start with gross margin. Using the median financial operating ratios from his latest benchmark report, John sees that his peers who earn 30 to 59 percent of their rental revenue from construction equipment achieved a 70.7 percent gross margin; his high-profit peers did even better, making almost 73 cents. John's gross margin in 2013 was 69 percent, 4 percent lower. Lest you think a few percentage points is small change, that 4 percent on his $1 million in sales could have dropped $40,000 right to his bottom line.
According to the roadmap, low gross margin is caused by the following: no cash discounts on payables, low productivity, poor inventory control, shrinkage, bookkeeping errors, poor buying, and poor pricing.
Let's focus now on low productivity, a key driver behind margins in the rental industry. A highly productive company generates high revenues from its rental investments. Looking at his peers' productivity ratios, we see that this was indeed an area in which John's company fell short. As shown above, John gets four cents less in gross margin for every dollar invested in rental assets than his most profitable peers. John has rental assets that cost him $800,000. If they were as productive as the assets of the top 25 percent, he'd have made another $32,000 in gross profit.
Reading through his industry benchmark report, John sees his issue: low gross profit in relation to the investment in rental equipment, along with several specific possible causes (under-utilized rental inventory, high costs of rental assets). Could his low gross margins be caused by any of the other factors listed above, such as poor pricing or poor buying? We checked the competition's prices and found that John could raise his prices without affecting his position in the market. An increase of only 1 percent on sales of a $1 million, and voila!, we found $10,000 more for the bottom line.
Next stop, cash flow. Since John shared with us that he ran into some cash crunches last year, let's look at how he rates in that department. According to our roadmap, low cash is caused by high current liabilities, too much inventory, and too much customer credit. While John appears to have done a decent job in managing his inventory, one of the key ratios--the current ratio--indicates that his solvency is off, compared with his peer group. In fact, for every dollar of current liabilities (that will need to be paid in the next year), the high-profit group has current assets (assets that will become cash within a year) of $2.43 to pay off their liabilities, compared with John's $1.75. (For his entire peer group, that figure was $1.39.)
Using the roadmap, we find that one of the possible causes behind his low cash is too much customer credit. And, as we'll see, something that can really drive up that number is taking too long to collect his accounts receivable (A/R). While his high-profit peers took 44 days to collect money from their customers, John took 52 days for his. This 8-day difference is crucial to his low cash situation.
If we know the formula for A/R turnover (the rate at which customer debts are collected on an annual basis), we can use these numbers to find out what his receivables "should" have been, had he managed his collections process as well as his peers did:
- If we know that A/R Turnover = Credit Sales ÷ A/R, then
- We can rearrange the formula like this: A/R = Credit Sales ÷ A/R Turnover.
- Then, if we add the word Target to both sides of the equation: Target A/R = Credit Sales ÷ Target A/R Turnover.
We know that John's 2013 sales were $1 million, and that 50 percent of sales were made on credit. We can then divide the credit sales by the high-profit group's A/R Turnover number of 8.4 (the target): Target A/R = $500,000 Credit Sales ÷ 8.4 Target Turns = $59,524. But John's actual A/R at year-end was $72,500, an A/R of nearly $13,000 more than his high-profit peers.
When you take the $13,000 excess A/R and divide it by 8 days, that's $1,625 for every day John lets his customers keep his cash. (You might recall that one of the causes behind low gross margin is not taking discounts on payables. With more cash, John might have nabbed some of those discounts and increased his margins--or maybe avoided that last-minute credit line and resulting interest.)
John has now found a plan to improve his collections and decides to schedule a management meeting today to put it into action. Let's summarize the results of our little sleuthing exercise:
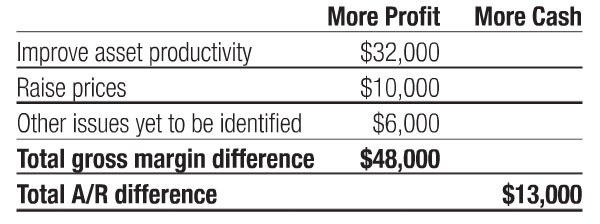
That's a total of $61,000 of improvements to profit and cash flow we found in just one quick trip around the roadmap--and we didn't even get into the third area of low net profits!
My challenge for you is simple. Use this format to take a trip through your business. As with any trip, you can't reach your destination without a map, and that's what this framework is: a financial roadmap. You can't solve the mysteries until you know what to ask and where to look!
Steve LeFever is the founder and chair of Business Resource Services (BRS), a Seattle-based consulting firm that provides financial management education, network benchmarking, performance group facilitation, and bookkeeping services for closely held businesses under its Profit Mastery brand. Learn more at www.profitmastery.net. or contact him at 800-488-3520 x14 or [email protected].
Share this Feature


Recommended Reading:

FRANCHISE TOPICS
- Multi-Unit Franchising
- Get Started in Franchising
- Franchise Growth
- Franchise Operations
- Open New Units
- Franchise Leadership
- Franchise Marketing
- Technology
- Franchise Law
- Franchise Awards
- Franchise Rankings
- Franchise Trends
- Franchise Development
- Featured Franchise Stories
FEATURED IN

Multi-Unit Franchisee Magazine: Issue 2, 2014


$175,000
$500,000

Franchising.com is produced by Franchise Update Media. Franchise Update Media has its finger on the pulse of franchising with unrivalled audience intelligence and market driven data. No media company understands the franchise landscape deeper than Franchise Update Media.
1201 New York Avenue NW, Suite 300A
Washington, DC 20005
PH. (408) 402-5681
 The multi-unit franchise opportunities listed above are not related to or endorsed by Multi-Unit Franchisee or Franchise Update Media Group. We are not engaged in, supporting, or endorsing any specific franchise, business opportunity, company or individual. No statement in this site is to be construed as a recommendation. We encourage prospective franchise buyers to perform extensive due diligence when considering a franchise opportunity.
Copyright © 2001 - 2025. All Rights Reserved. Legal Notices | Privacy Policy


