2020 AFDR: How Do You Measure Up?

Results from the 2020 Annual Franchise Development Report (AFDR) were unveiled in late October at the 21st annual Franchise Leadership & Development Conference (FLDC) in Atlanta. The 2020 AFDR is based on responses from 122 franchisors representing 30,119 units.
Participants in the survey consisted of franchisors that completed an online questionnaire. Responses were aggregated and analyzed to produce a detailed look into the recruitment and development practices, budgets, and strategies of a wide cross-section of franchisors. The data and accompanying commentary and analysis provide the basis of the 2020 AFDR.
Highlights from the report were presented in a general session at the conference by Franchise Update Media's CEO Therese Thilgen and Executive Vice President and Chief Content Officer Diane Phibbs. Below are additional highlights from the 2020 AFDR. Ordering information can be found on page 34. (Conference attendees received a complimentary copy.)
The View From 30,000 Feet
|
It's all about the candidate experience... |
It's not JUST |
FD is a |
|---|---|---|
|
|
|
The way franchise prospects research franchise opportunities is changing. With so much information about a brand available online today, prospects conduct most of their due diligence long before they pick up the phone and engage with a brand, notes Phibbs. And, she says, that initial research is not only about the brand itself.
"When prospects look at a franchise opportunity, they also look at how a brand engages with its customers. They look at marketing programs, social media, PR, and visit or shop your brand themselves," she says. And they often talk with franchisees before they talk to you.
Key factors revealed in the AFDR and mystery shopping this year include the following, says Phibbs:
- With so much initial research taking place on the Internet, it's critical to position your franchise opportunity in the best possible light online. This matters more than ever. Your website must engage prospects and provide important details to invite them to take the next step.
- Franchise development is a team sport. How each department interacts with franchisees and end customers is huge. It's franchise development's responsibility to get the executive team and their peers educated and invested in development.
- Business conditions at the unit level are critical to franchise development. If your units/locations aren't doing well, your ability to grow will be affected. There aren't enough leads in the world to overcome unhappy franchisees and negative sales and profits.
Recruitment Budgets
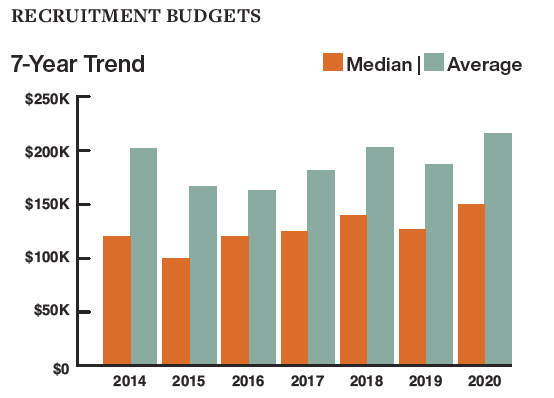 After remaining relatively level from 2014 through 2019, average and median budget plans for 2020 franchise sales and recruitment budgets (advertising and media expenses not including brokers and employee compensation) are both increasing. From 2014 through 2019, average recruitment budgets ranged between a low of $162,821 (2016) and a high of $204,262 (2018); while median recruitment budgets ranged from a low of $100,000 (2015) to a high of $140,000 (2018). For 2020 both the average and median budget plans among the respondents are higher: $215,173 and $150,000, respectively.
"We've heard that franchise sales have been slow for some brands this year," says Phibbs. "The change in budgets could be an indication of slowing sales. The economy can play a part in this too. If the economy is good and jobs plentiful, people aren't looking for their next opportunity as much as they are in a weak economy."
2019 Spend: Budget vs. Effectiveness
In a departure from previous years, where the AFDR measured "where the money goes" by category (digital, print, etc.), this year we've calculated theeffectiveness of that spending by category. This graph, showing the weighted average of budget versus effectiveness, provides a good picture of what's working. Phibbs had several observations based on this new data set:
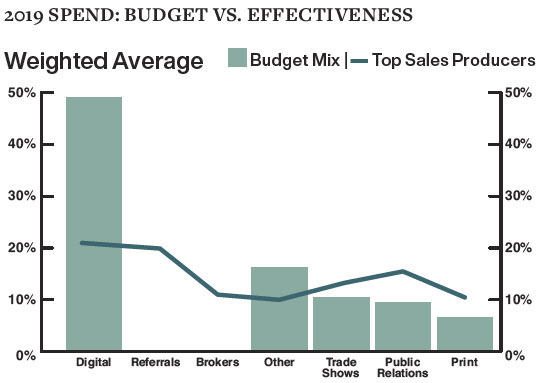 Lead attribution is really important. To make better, more informed decisions on how to spend their franchisee recruitment dollars, brands should know how each prospect first learned about them. While prospects may not be 100 percent certain themselves (radio?, billboard?, a friend?), it's important to ask them, both during the initial call with qualifiers and on subsequent calls with sales executives. Take print, for example, which is showing itself as effective as other media, but is difficult to track without those conversations.
- Digital isn't as effective as it seems, but it's easy to track. Although many franchisors reported that a lead came from its franchise opportunity website, that can't be the source. A prospect must have learned about the brand and then visited the website.
- Brokers remain an effective, but costly lead source, according to respondents. "In previous years, the AFDR didn't track brokers in the budget breakdown," says Phibbs. "It was our understanding that the franchisee recruitment and management fees were paid out of the portion of the franchise fee brokers take and were not a recruitment budget line item. We're learning that this either has changed or hasn't been the case. Many franchisors now include brokers as a line item in their recruitment budget. We'll be updating the AFDR survey to include this in the future."
- Referrals, at 36 percent, are the second-highest sales producer. Many franchisors have instituted a formal referral program for franchisees, offering cash rewards, discounts, or other incentives. Do you have a program for internal franchisee expansion and referrals? What about with your vendors and other stakeholders or partners?
- Most important, are your franchisees happy and successful? No one sells better than a happy franchisee!
Digital Spend: Budget vs. Effectiveness
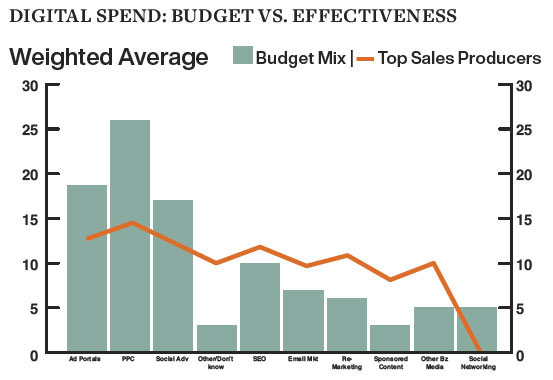 Again, rather than simply report on "where the digital money goes," this year's AFDR examined the effectiveness of that spend. This graph shows there are effective digital tools outside of digital ads and portals. A deep dive into digital results is needed if a brand is putting a lot of spend into these areas. In the 2020 results, Phibbs notes, ad portals were the most effective spend for the money. "I wonder if PPC effectiveness is not as strong because of today's expanding digital advertising options," she says. "Social advertising has grown as a significant spend, but doesn't seem to be as optimized in effectiveness for the money brands are spending on it."
Measuring Costs
Cost per lead and cost per sale are arguably the two most important metrics in franchise recruitment. Both increased this year. As we've noted before, why 100 percent of franchisors don't track these critical numbers remains a mystery--and probably a major reason many development departments continue to miss their annual sales goals.
In this year's AFDR, 8 in 10 (79 percent) respondents tracked cost per lead; this compares with 65 percent last year. The good news is that more brands are tracking cost per lead; the bad news, of course, is that 2 in 10 still don't. Average cost per lead (among the two-thirds that tracked it) was $213; that compares with $126 last year, marking a much greater increase than in previous years. Median cost per lead this year was $91.
Looking at cost per sale, which many view as the most important recruitment metric, only 65 percent of brands in the survey tracked this figure. While this shows strong improvement from 53 percent last year, it still means that more than 1 in 3 (35 percent) brands still do not track this most valuable metric. The nearly two-thirds that tracked cost per sale reported an average of $10,500, up significantly from previous years. Median cost per sale this year was $8,000.
"Based on the budget vs. effectiveness charts, this calls for a full evaluation of your program to determine whether your spend is being placed where it's most effective," says Phibbs. "Get the most bang for your buck."
(As a technical note, Phibbs says the costs shown here include both new and existing franchisee deals and were counted by unit/location sold vs. the entire deal (5 units counted vs. 1 deal).
Big picture-wise, the good news is that more franchisor executives are tracking cost per lead and cost per sale than ever before.
|
Measuring Costs |
|---|
|
Sales Closing Ratios
Another crucial set of metrics in evaluating the effectiveness of a franchise development team are the ratios of leads to sales, applications to sales, and discovery days to sales. "The ratios have all improved over the past year, which is good news," says Phibbs. "The question is: Are lead conversions going up because there's a smaller, but more qualified set of leads?" An additional factor for today's higher lead-to-close ratios is the copious research conducted by prospects before they ever contact a brand, in essence, self-qualifying based on what they've learned online and by speaking with franchisees.
Since more brands are employing lead qualifiers, last year's AFDR added a new category for qualified leads. The difference is clearly illustrated in the slide: qualified leads to sales were 15 percent, five times better than the 2.9 percent for all leads to sales. This significantly higher closing ratio speaks to the importance of having a pre-qualifier at the front end of your sales process. Weeding out the more questionable leads on the front end saves the sales team a lot of wasted time and effort during the ensuing stages of the sales process.
The applications to sales ratio, at 27.7 percent, improved from 23 percent last year and was generally within the range of preceding years. The ratio for discovery days to sales, at 76.7 percent, was up from 71 percent and 72 percent in the preceding 2 years.
In addition to the increased use of pre-qualifiers, Phibbs notes that ongoing tweaks and improvements to the sales process affect conversions as well. Still, she says, "The mystery shopping results show there remains a lot of room for improvement."
|
Sales Closing Ratios |
|---|
|
2020 AFDR Now Available!
The 2020 Annual Franchise Development Report (AFDR) delivers data collected from 122 franchisors representing 30,119 units, with responses organized by industry, unit investment, system-wide sales, and more. The annual report provides franchisors with the ideal tool for studying their development practices, benchmarking their sales and recruitment budgets against their own industry categories, and setting goals and budgets for the year ahead. The report also includes research into online recruitment practices, the growing use of mobile and social tools by prospects, and best practices by franchisors.
The AFDR, the only sales and lead generation benchmark report available in franchising, identifies industry sales trends and top lead generation sources for meeting sales goals. For example:
- How does your sales budget compare with other brands in your segment?
- Are your closing ratios in line with your industry and investment level?
- What conversion rates should you expect from your website?
- Is your online spending paying off? How do you know?
- Are your brokers delivering--and is their price per deal too high?
- Are you using referrals, and how much are you paying for them?
- How are franchisors using social media to recruit candidates?
- Some franchisors are exceeding their sales goals. What are they doing differently from those falling short?
The 2020 AFDR is packed with timely information and benchmarking data that can help your franchise system grow faster and close more deals--while saving thousands of dollars in cost per sale. Based on in-depth surveys from 122 franchise companies, this thoroughly researched report reveals the success drivers that are sure to boost the output and quality of your sales department.
Filled with the most comprehensive sales and lead generation data in franchising, the 2020 AFDR, at more than 200 pages, is a must-have tool for franchisors, development consultants, and advertising, marketing, and technology suppliers--and is ideal for benchmarking and building budgets and media plans.
The complete 2020 AFDR, with analysis and benchmarks, is available for $200 until December 31. After that is $350. For ordering information, visit afdr.franchiseupdate.com or email questions to [email protected].
Share this Feature


Recommended Reading:

FRANCHISE TOPICS
- Multi-Unit Franchising
- Get Started in Franchising
- Franchise Growth
- Franchise Operations
- Open New Units
- Franchise Leadership
- Franchise Marketing
- Technology
- Franchise Law
- Franchise Awards
- Franchise Rankings
- Franchise Trends
- Franchise Development
- Featured Franchise Stories
FEATURED IN
Franchise Update Magazine: Issue 4, 2019


Franchising.com is produced by Franchise Update Media. Franchise Update Media has its finger on the pulse of franchising with unrivalled audience intelligence and market driven data. No media company understands the franchise landscape deeper than Franchise Update Media.
P.O. Box 20547
San Jose, CA 95160
PH. (408) 402-5681
 The franchise listed above are not related to or endorsed by Franchise Update or Franchise Update Media Group. We are not engaged in, supporting, or endorsing any specific franchise, business opportunity, company or individual. No statement in this site is to be construed as a recommendation. We encourage prospective franchise buyers to perform extensive due diligence when considering a franchise opportunity.
Copyright © 2001 - 2025. All Rights Reserved. Legal Notices | Privacy Policy


