Ratios Rule!: But Do You Know Which Financial Ratios To Watch?
In earlier articles, I have discussed your two key yardsticks of financial performance: the balance sheet and the income statement. Taken together, they represent as complete a financial picture of your company as it's possible to get.
Now, it's a common practice (and a sensible one) for businesses to have at least two sets of financial statements (or maybe three): one for the IRS (with the tax rules and regulations making net profit look as small as possible); one for your banker (adjusted to present the most glowing picture of the business); and one for yourself. But remember you can't fool all of the people all of the time. And the worst possible person to fool is yourself. You need clear, concise, decision-relevant information.
Incidentally, two or three sets of statements does not imply more two or more sets of books (the general journal and the general ledger, which report all financial events that occur in the business). Having more than one set of books implies falsifying financial transactions, and that's a good way to go straight to jail, courtesy of the IRS. On the other hand, a company's financial statements put the information from the books into a format influenced by the purpose for which the statements are being developed.
With that in mind, let's take your financial information and develop a set of measurements that will allow us to monitor both your current position and your progress. We will do this through the development of a series of financial relationships, or ratios. Remember, a ratio is nothing more than one number in relation to another. However, ratios have the very practical property of reducing a relationship to one number, no matter the size of the two numbers involved. (For example, the ratio of 2:1 can be derived from 20 divided by 10, 200 divided by 100, or 200,000 divided by 100,000.) The ratio doesn't care about the absolute size, only the relationship of the numbers. And it's this relationship we will use to measure and manage your financial effectiveness.
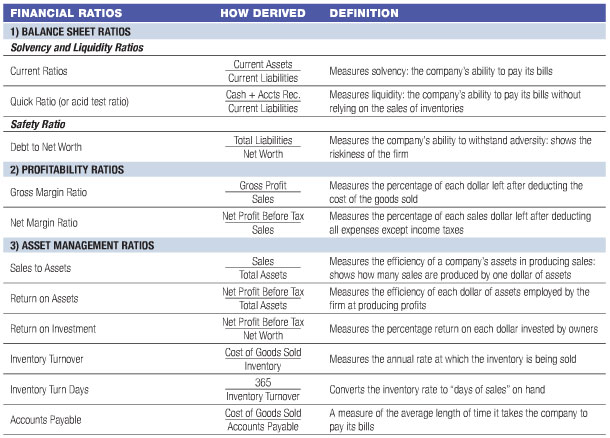
Clearly the question arises as to which relationships to measure. There are many possibilities, and each financial analyst will have their own preferences. I have chosen to use the K.I.S.S. (Keep it Simple, Silly!) approach; that is, enough to get the job done, but not so much as to become confusing. The accompanying chart has three basic parts: 1) the name of the ratio, 2) how it is derived, and what it measures. In the next issue I will address the key point: namely, why would anyone in their right mind do this?
For now, let's be clear on the action steps. First, you need 3 years of financial statements (or as many as you have). Second, you need to lay out your statements in a spreadsheet format (which is nothing more than putting all the financial data on one sheet, side-by-side, by year). Third, use the same spreadsheet format to calculate your financial ratios.
Take a few minutes to read and study the ratios in the table, how they're derived, and what they measure. Note that the ratios are broken down into three functional areas: 1) balance sheet ratios, 2) profitability ratios, and 3) asset management ratios. We will be looking to develop financial "balance," since no individual ratio is the entire story. Taken together, however, we can now begin the process of analyzing your performance--and more important, planning for the future.
In general, there are three ways to use these ratios to analyze your business. The first is to compare your current performance with your performance in previous years (trends). The second is to compare your present performance with others in your industry (I'll provide some industry figures next time). And third is to compare your ratios with your plans in developing a workable operating strategy.
You operate and manage your firm with limited resources, management, capital, and time. You can't fix current problems or spot developing ones unless you know where to look. This "Fiscal Physical" process I'm describing is merely an efficient, effective method to keep your finger on the pulse of your company.
Steve LeFever is the founder and chair of Business Resource Services (BRS), a Seattle-based consulting firm that provides financial management education, network benchmarking, performance group facilitation, and bookkeeping services for closely held businesses under its Profit Mastery brand. Learn more at www.profitmastery.net. or contact him at 800-488-3520 x14 or [email protected].
Share this Feature


Recommended Reading:

FRANCHISE TOPICS
- Multi-Unit Franchising
- Get Started in Franchising
- Franchise Growth
- Franchise Operations
- Open New Units
- Franchise Leadership
- Franchise Marketing
- Technology
- Franchise Law
- Franchise Awards
- Franchise Rankings
- Franchise Trends
- Franchise Development
- Featured Franchise Stories
FEATURED IN

Multi-Unit Franchisee Magazine: Issue 1, 2014


$211,400
$30,000

Franchising.com is produced by Franchise Update Media. Franchise Update Media has its finger on the pulse of franchising with unrivalled audience intelligence and market driven data. No media company understands the franchise landscape deeper than Franchise Update Media.
1201 New York Avenue NW, Suite 300A
Washington, DC 20005
PH. (408) 402-5681
 The multi-unit franchise opportunities listed above are not related to or endorsed by Multi-Unit Franchisee or Franchise Update Media Group. We are not engaged in, supporting, or endorsing any specific franchise, business opportunity, company or individual. No statement in this site is to be construed as a recommendation. We encourage prospective franchise buyers to perform extensive due diligence when considering a franchise opportunity.
Copyright © 2001 - 2025. All Rights Reserved. Legal Notices | Privacy Policy


